The Statement
While scientists predict 2020 will be one of the hottest years on record, Australian politician Craig Kelly has posted data he claims show temperatures have in fact been falling during what he dubbed "the year of global cooling".
In a Facebook post on December 21, the federal Liberal Party MP cited figures he said demonstrated average global temperatures have dropped over the past 12 months.
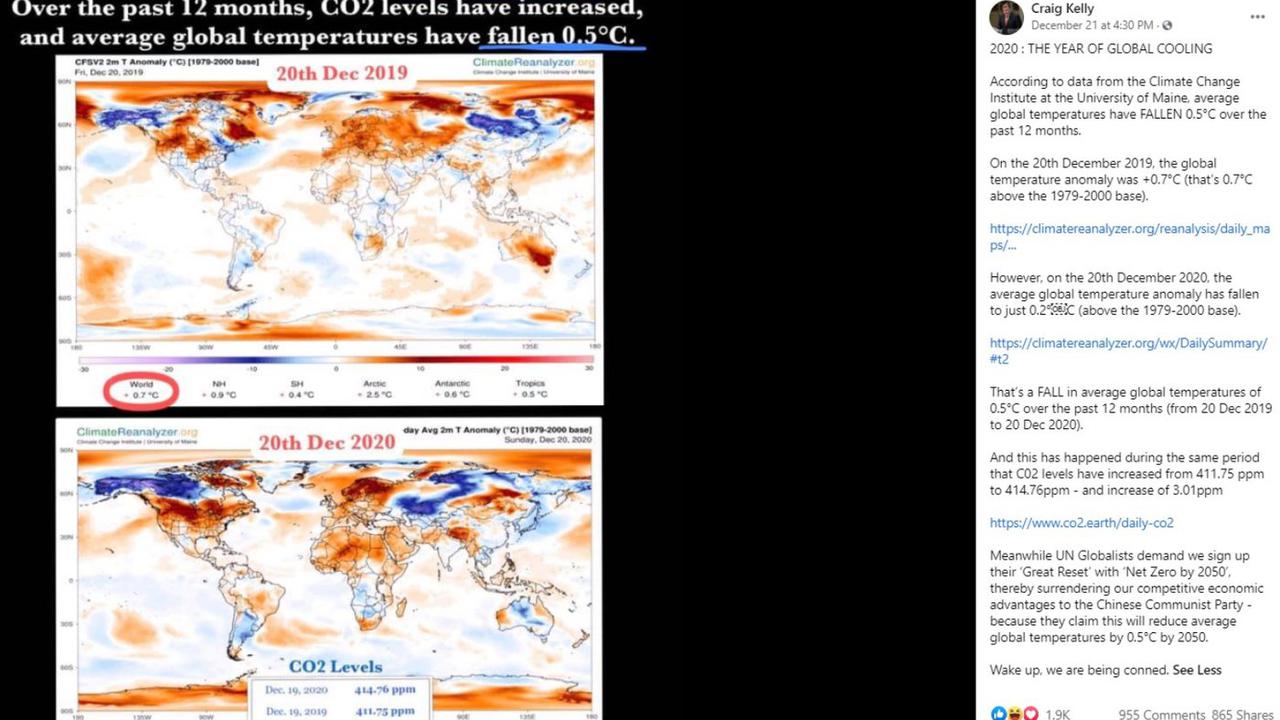
"On the 20th December 2019, the global temperature anomaly was +0.7°C (that's 0.7°C above the 1979-2000 base)," Mr Kelly said. "However, on the 20th December 2020, the average global temperature anomaly has fallen to just 0.2°C (above the 1979-2000 base).
"That's a FALL in average global temperatures of 0.5°C over the past 12 months (from 20 Dec 2019 to 20 Dec 2020). And this has happened during the same period that C02 levels have increased from 411.75 ppm to 414.76ppm - and increase of 3.01ppm [sic].
"Meanwhile UN Globalists demand we sign up their 'Great Reset' with 'Net Zero by 2050', thereby surrendering our competitive economic advantages to the Chinese Communist Party – because they claim this will reduce average global temperatures by 0.5°C by 2050 [sic]. Wake up, we are being conned."
The post, which went out to the more than 84,000 followers of Mr Kelly's verified Facebook page, includes images of two climate maps from the global temperature tracking website ClimateReanalyzer.org showing temperature changes on the two cited dates.
At the time of publication, the post had been shared more than 860 times, attracting more than 1,900 reactions and 950 comments.
The Analysis
Although the figures cited by Craig Kelly are broadly accurate, they don't demonstrate that average global temperatures have fallen between 2019 and 2020 - nor do they reveal that higher greenhouse gas emissions aren't warming the Earth.
The Climate Reanalyzer website provides daily figures on global temperature changes by collating publicly available official data. It is run by Sean Birkel, a research assistant professor at the University of Maine Climate Change Institute.
The daily updates include a figure showing the extent to which the global temperature that day deviates from average temperature between 1979 and 2000 (see 2m Temp Anomaly section).
The website provides slightly different figures to those Mr Kelly cited, but they do show the temperature anomaly on December 20, 2020 was lower than the temperature anomaly on the same date a year earlier.
On December 20, 2019, the temperature anomaly was 0.7°C above the baseline temperature, while on December 20, 2020 it was 0.3°C above the baseline temperature (not 0.2°C, as Mr Kelly's post states).
Importantly, these figures only show global temperature variations on two individual days. An analysis of monthly and annual figures shows fluctuations, but also a marked increase in global temperature from 1948 (the earliest date available) to October 2020 (the most recent figure).
Australian National University Climate Change Institute director Mark Howden said Mr Kelly's post was a classic example of cherry-picking data and there was "no merit" to the claims he made.
Prof Howden said 2020 is set to be one of the warmest years recorded, and so far every month in the year had been warmer than the equivalent period in 2019.
He pointed to figures from the US government's National Oceanic and Atmospheric Administration (NOAA), which showed 2020 had a more than 50 per cent chance of being the warmest year on record, ahead of the current record-holder, 2016.
NOAA figures also showed the year to date was hotter than 2019, and every month in 2020 had been warmer than the same period a year earlier.
"Last year was a warm year but not as warm as this year ... so it makes no sense to say that the globe has cooled," Prof Howden told AAP FactCheck via email.
He noted that the temperature anomaly - the difference against long-term global averages - for each month of 2020 had lessened since March as the world transitioned from an El Niño to a La Niña weather pattern.
However, he added that changes in climate were calculated by looking at trends over decades, not by comparing two dates 12 months apart.
"Climate is essentially constructed from long-term averages. A rule of thumb is about 30 years of records (are) needed in a place to get a handle on what the average climate conditions are, due to year-to-year variability."
He said evidence of the connection between global temperature and CO2 levels was incredibly robust.
"To think that cherry-picking a few dates can overturn the consistent, peer-reviewed, 170 years of accumulated science and data is verging on the dangerous."
Dr Birkel, who runs the Climate Reanalyzer website, said "comparing two days separated by a year is not sufficient to deduce a climate trend".
"Weather patterns can bring significant changes in the distribution of heat across the globe day-to-day and week-to-week," he told AAP FactCheck via email.
"While a daily temperature anomaly value for a given region on a given day does carry some baseline climate information, it is nonetheless strongly influenced by weather. In order to deduce climate trends, it is necessary to examine changes over decadal and longer timescales."
In addition to the website's annual temperature anomaly tracker, which shows a clear trend of increasing global temperatures since 1948, it also includes a section dedicated to climate change showing temperature increases over the past century and projected increases for the future.
Dr Birkel said he would update his website to advise people against drawing conclusions based on a comparison of daily figures alone.
Earlier this month, the UN said 2020 is on track to be one of the three hottest years on record at about 1.2°C above the pre-industrial average. This was despite the presence of the La Niña weather pattern, which usually resulted in cooler temperatures.
Figures from NASA chart global temperatures from 1884 to 2019 and show 19 of the 20 warmest years on record have occurred since 2001, with the exception of 1998. Despite annual fluctuations, its figures show a steady rise in global temperatures since the early 20th century.
NOAA analysis also demonstrates a strong correlation between atmospheric CO2 levels and temperature over the past 800,000 years. The organisation states: "When the carbon dioxide concentration goes up, temperature goes up. When the carbon dioxide concentration goes down, temperature goes down."
The agency said the last time CO2 levels were as high as today the temperature was 2° to 3°C higher than pre-industrial levels and sea levels were 15 to 25 metres higher. The annual rate of increase in atmospheric CO2 over the past 60 years was also about 100 times faster than previous natural increases, which it said was mostly due to humans burning fossil fuels for energy.
In Australia, figures from the Bureau of Meteorology spanning from 1910 to 2019 also show temperatures have increased significantly, both in Australia and globally. It said last year was Australia's warmest year on record, while spring in 2020 was the country;s warmest on record.
The Bureau's State of the Climate 2020 report found Australia's climate has warmed by 1.44°C on average since records began in 1910. In an accompanying press release, CSIRO Climate Science Centre director Jaci Brown said the increasing temperatures were due to human-induced climate change.
"Our science clearly shows that due to increasing greenhouse gases, such as carbon dioxide, in the atmosphere, Australia's climate is continuing to warm, and the frequency of extreme events such as bushfires, droughts, and marine heatwaves is growing," Dr Brown said.

The Verdict
AAP FactCheck found Mr Kelly's statement that 2020 has been "the year of global cooling" with average temperatures worldwide falling by 0.5°C over the past 12 months to be false.
Experts said the figures Mr Kelly cited do not show overall temperatures have decreased, with data from official sources showing 2020 is set to be one of the warmest years on record – even warmer than the previous year.
False – Content that has no basis in fact.
* Editor's note: AAP FactCheck has expanded its ability to fact-check environmental issues with the support of the Australian Conservation Foundation. AAP FactCheck retains full editorial independence in this project and continues to apply the rigorous standards required for accredited members of the International Fact-Checking Network.