WHAT WAS CLAIMED
A graph proves humans are responsible for only around 3.5 per cent of the increase in atmospheric CO2 from 1870 to 2020.
OUR VERDICT
False. The author has mistaken the graph’s annual emissions figure for the cumulative total since 1870. Humans are responsible for 100 per cent of the increase.
A Facebook user has downplayed the role of human activity in the rise of atmospheric carbon dioxide levels by claiming humans are only responsible for about 3.5 per cent of the total increase since the end of the 19th century.
This is inaccurate. The post's author has made several calculation errors in his explanation. Experts say humans are entirely responsible for the increase in atmospheric CO2.
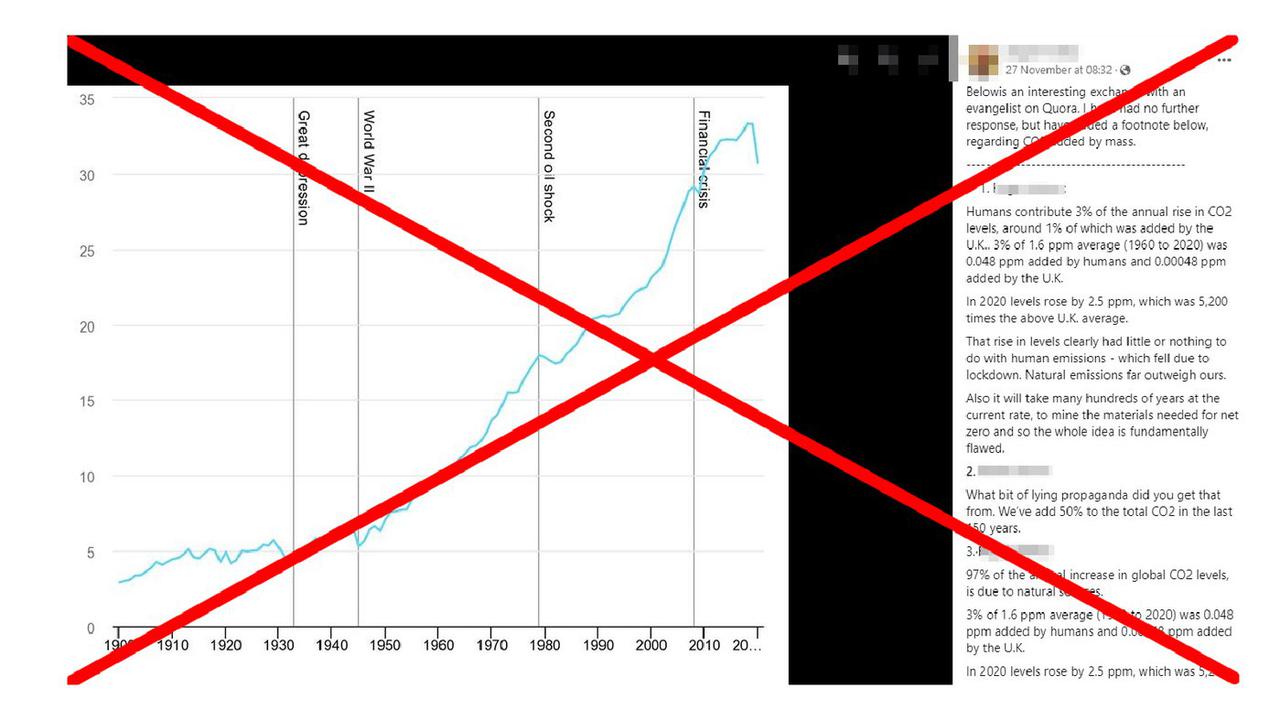
The post (archived here) was shared to a climate change discussion group on November 27. It reads: "Between 1870 and 2020, the CO2 levels increased from around 280ppm to around 420ppm. There is around 3,210 Gt of CO2 in the atmosphere now, against CO2 levels of around 2,140Gt in 1870 - a difference of 1,070 Gt.
"The graph indicates that humans have added almost 35Gt of CO2 to the atmosphere since 1870, compared with a total increase in levels of around 1,070Gt. So humans emitted around 3.5% of the total rise, over that period."
The post includes a graph showing historical carbon dioxide emissions from 1900 to 2020 based on a Statista chart, which uses data from the Global Carbon Project's 2021 Global Carbon Budget dataset.
But the post is wrong on a number of points.
Firstly, the user claims the graph indicates that humans have added almost 35 gigatonnes (Gt) of CO2 to the atmosphere since 1870. But the data actually shows historical CO2 emissions from global fossil fuel combustion and industrial processes per year - not a cumulative amount.
The Global Carbon Project states its data values are "in billion tonnes of carbon per year (GtC/yr) for the globe".
Robbie Andrew, a senior researcher at the Centre for International Climate Research in Oslo, said "the mistake made here is very simple".
"The graph shows the emissions in each year, not the accumulated total," he told AAP FactCheck in an email.
"So while he claims that the sum of all our fossil CO2 emissions since 1870 are 35 Gt … that is about what we emitted in the single year of 2020."
The Global Carbon Project's report states the actual cumulative anthropogenic CO2 emissions between 1850 and 2020 is around 2420 Gt (p1940).
Professor Brendan Mackey, director of the Griffith Action Beacon and Climate Change Response Program at Griffith University, also pointed to the Intergovernmental Panel on Climate Change (IPCC)'s Working Group 1 2021 report.
It features a similar figure of 2,390 ± 240 (likely range) Gt of anthropogenic CO2 between 1850 to 2019 (p29 of the report's Summary for Policymakers).
"That person's value is two orders of magnitude low," Prof Mackey said in an email.
Dr Amanda Maycock, an associate professor in climate dynamics at the University of Leeds, explained the difference between emissions and atmospheric concentration of CO2.
"CO2 emissions represent the total mass of carbon emitted into the air. Around 45 per cent of this mass remains in the air and causes the CO2 concentration to rise. Concentration represents the volume of CO2 as a proportion of the total volume of air," she said via email.
The figures for levels of atmospheric concentration of CO2 in 1870 and 2020 in the post are roughly accurate. According to the National Oceanic and Atmospheric Administration (NOAA)'s Global Monitoring Laboratory, average global atmospheric levels in 2020 were 412.5 parts per million (ppm). Pre-industrial levels are estimated to have been 280 ppm.
Peter Rayner, a professor of climate science at The University of Melbourne, explained one ppm of CO2 equals about 7.78 Gt of CO2 in the atmosphere.
After converting figures for ppm to Gt, the user subtracts the amount of atmospheric CO2 in 1870 from the amount in 2020 to determine that 1,070 Gt of CO2 has been added. He determines that humans are only responsible for about a small percentage of the increase in atmospheric CO2 because 35 Gt is about 3.5 per cent of 1,070 Gt.
Dr Maycock told AAP FactCheck that "to quantify the contribution of human activities to the rise in atmospheric CO2 concentration since the 19th century, we must add up the emissions from all years, subtract the part that does not remain in the atmosphere … and also account for the lifetime of CO2 in the air".
The 1,070 Gt figure is approximately 45 per cent of 2,390 Gt - the actual amount of CO2 humans have emitted - and accounts for emissions that remain in the atmosphere after the majority is absorbed by carbon sinks, including plants, the ocean and soil.
Dr Maycock also pointed to IPCC's Sixth Assessment Report, which "concluded that atmospheric CO2 concentrations are currently higher than at any time in at least two million years, and it is virtually certain (greater than 99 per cent probability) that the main cause of the increase since 1850 is human activity".
The IPCC states that "observed increases in well-mixed greenhouse gas (GHG) concentrations since around 1750 are unequivocally caused by human activities" (page 4).
Dr Robyn Schofield, an associate professor in atmospheric chemistry at the University of Melbourne, previously told AAP FactCheck the entirety of the increase in atmospheric CO2 was due to human activities such as land clearing and burning of fossil fuels, to debunk a similar claim by federal MP Colin Boyce.
The Verdict
The claim that humans are responsible for about 3.5 per cent of the increase in atmospheric CO2 levels since 1870 is false. The Facebook user has made several errors in his calculations. In particular, he has taken a figure for emissions from a single year to represent all human CO2 emissions since 1870. Humans have emitted approximately 2,390 Gt of CO2 since 1870, not the 35 Gt as claimed.
Experts confirmed to AAP FactCheck that the CO2 increase has been entirely caused by human activity.
False - The claim is inaccurate.
AAP FactCheck is an accredited member of the International Fact-Checking Network. To keep up with our latest fact checks, follow us on Facebook, Twitter and Instagram.