
WHAT WAS CLAIMED
A graph proves that the earth is cooler today than it has been for the majority of the last 9500 years.
OUR VERDICT
False. The graph shows temperatures from a Greenland ice core and only goes up to 1885. Today’s global mean surface temperature is higher than almost all of the last 9500 years.
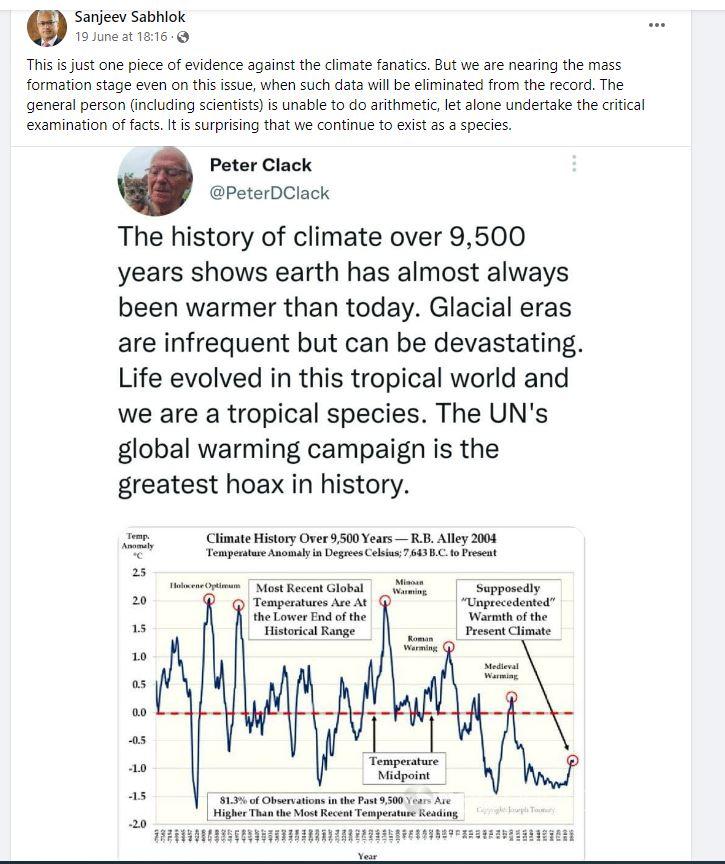
A tweet shared to Facebook uses a graph as "evidence" to claim earth is cooler today than it has been for the majority of the last 9500 years.
However, the claim is false. Experts told AAP FactCheck that scientific evidence proves the opposite is true - global average temperatures in the past decades have been higher than most, if not all, of the last 10,000 years.
The claim from a Twitter user reads: "The history of climate over 9,500 years shows earth has almost always been warmer than today... The UN's global warming campaign is the greatest hoax in history."
Distinguished Professor Peter Clark, Distinguished Professor Alan Mix, Associate Professor Jeremy Shakun, and Regents' Professor Darrell Kaufman pointed AAP FactCheck to three important studies that reconstruct global mean surface temperatures over thousands of years.
A 2013 study by Prof Clark, Prof Mix, Prof Shakun and Associate Professor Shaun Marcott, reconstructed global mean surface temperatures and found that temperatures today are "higher than those during 90 per cent of the entire Holocene."
A 2020 study, co-authored by Prof Kaufman, found that the warmest 200-year period of the Holocene before industrialisation took place around 6500 years ago when global surface temperatures were about 0.7 degrees Celsius warmer than in the 19th century.
During the period between 2011 and 2019, however, temperatures averaged 1C higher than the 19th century, which brings recent temperatures above that of the entire Holocene.
In a 2022 technical note by Prof Kaufman, he concluded that "human-caused global warming is now exceeding the warmest multi-century period of the Holocene and thereby the envelope of temperatures under which agriculturally based society has flourished".
A 2021 study reconstructed global mean surface temperatures over the past 24,000 years. Although its methods and some of its findings differed from previous studies, it still found that the global average surface temperature in recent years surpassed those of the past 24,000 years.
Prof Clark told AAP FactCheck in an email the post's claim was "absolute rubbish," and that the temperature reconstruction in the graph "is complete nonsense/fantasy".
Prof Shakun agreed the claim was false and said the "1.2 (degrees Celsius) of recent warming makes the world warmer now than it has been for the vast majority, if not the entirety, of the past 10,000 years".
Prof Kaufman said via email that the "evidence shows that a global average surface temperature of 1C above pre-industrial (like that of the last decade) is probably higher than anytime during the past 10,000 years."
The experts also said the graph in the tweet is problematic and has a history of being mislabelled and misused.
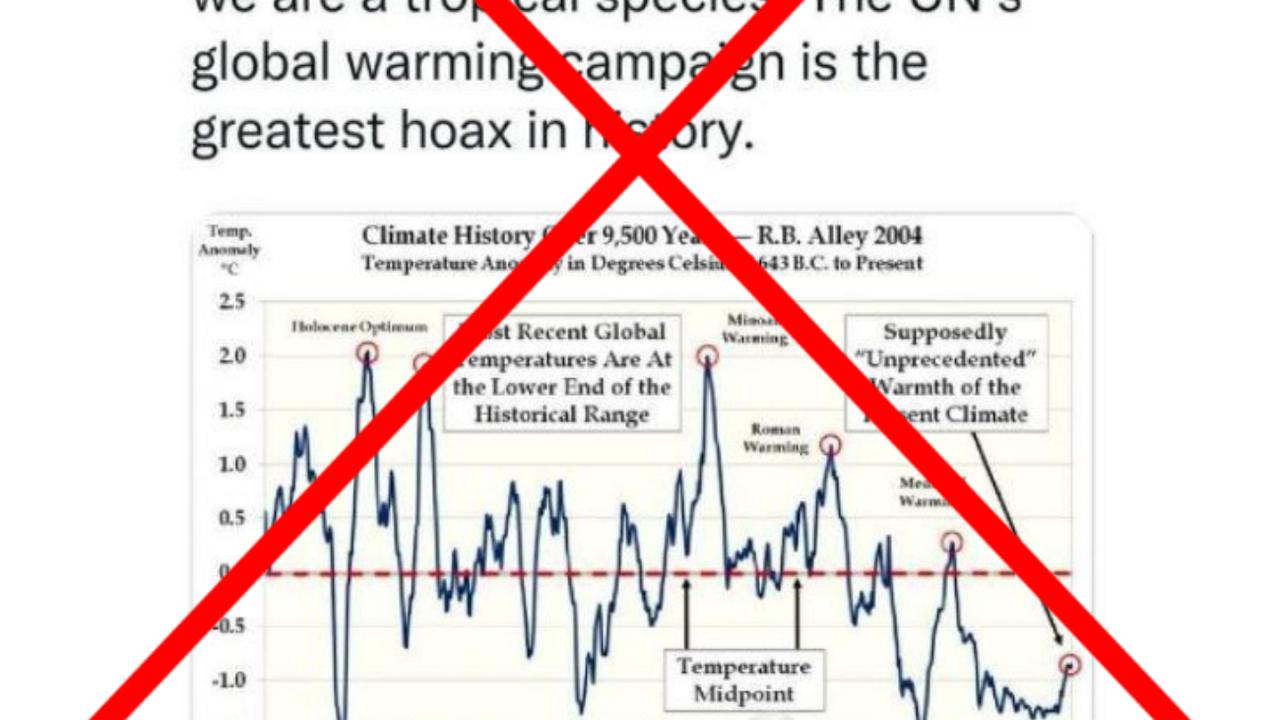
The graph is titled "Climate History Over 9,500 Years" and it appears to plot a series of temperature points from 7643 BCE to 1885 CE.
Prof Mix said extrapolating the claim from the graph was problematic given it plots temperatures from "one particular high elevation site atop the Greenland Ice Sheet....not global temperatures."
He also noted the graph ends in the year 1885, "an anomalously cold time. So it appears some particular data were picked for this tweet, and other data were excluded".
Prof Shakun told AAP FactCheck that the graph "shows local temperature in central Greenland reconstructed from an ice core".
"It is very misleading to make statements about global climate change based on single locations," he added.
The Facebook post's version of the graph closely resembles one posted by a LinkedIn user six years ago. In both the tweet and the LinkedIn post, the graph is marked "Copyright: Joseph Toomey" and the data is attributed to "R. B. Alley" or Richard B. Alley, a professor of geosciences at Penn State University.
Prof Alley described the graph in an email to AAP FactCheck as a "zombie that just won't die". He pointed to a debunk by Andrew Revkin for the New York Times blog Dot Earth in 2010 and a fact check by Carbon Brief in 2019.
As reported by Carbon Brief, the graph is based on temperatures from one Greenland ice core recorded in 1997. Prof Alley reproduced this data in a 2000 study, which was then used in a 2009 blog post to suggest that human-emitted CO2 cannot be the only thing accounting for the recent warming trend.
It has since been cited by a number of climate change sceptics (see here, here, and here) each reproducing and sometimes altering the graph for their own purposes. Misleading use of the graph has also been debunked by the Skeptical Science website in 2011.
The Verdict
The claim that earth is cooler today than it has been for most of the past 9500 years is false. Multiple experts confirmed to AAP FactCheck that global average surface temperatures in recent decades surpass those of most, if not all, of the last 10,000 years.
The graph used to support the claim is a favourite of climate change sceptics and is based on data from a single location in Greenland.
False - The claim is inaccurate.
AAP FactCheck is an accredited member of the International Fact-Checking Network. To keep up with our latest fact checks, follow us on Facebook, Twitter and Instagram.


