WHAT WAS CLAIMED
The referendum results from electorates with the largest Indigenous populations show Aboriginal and Torres Strait Islander people did not support the voice.
OUR VERDICT
False. The results cannot be used accurately to show how Indigenous people voted as they are among the minority of voters in all electorates.
There are claims voice referendum results in electorates with large Indigenous populations prove Aboriginal and Torres Strait Islander people didn't support the proposal.
This is false. Polling and election experts told AAP FactCheck electorate results were no indication of how Indigenous people voted, as they were still a minority of the voters in those electorates.
The claim is being shared widely on social media, largely with the use of this graphic (examples here, here, here, here and here).
The Conservative Political Action Conference (CPAC) Australia group, of which prominent 'no' campaigner Warren Mundine is the board chairman, made a similar claim on X.
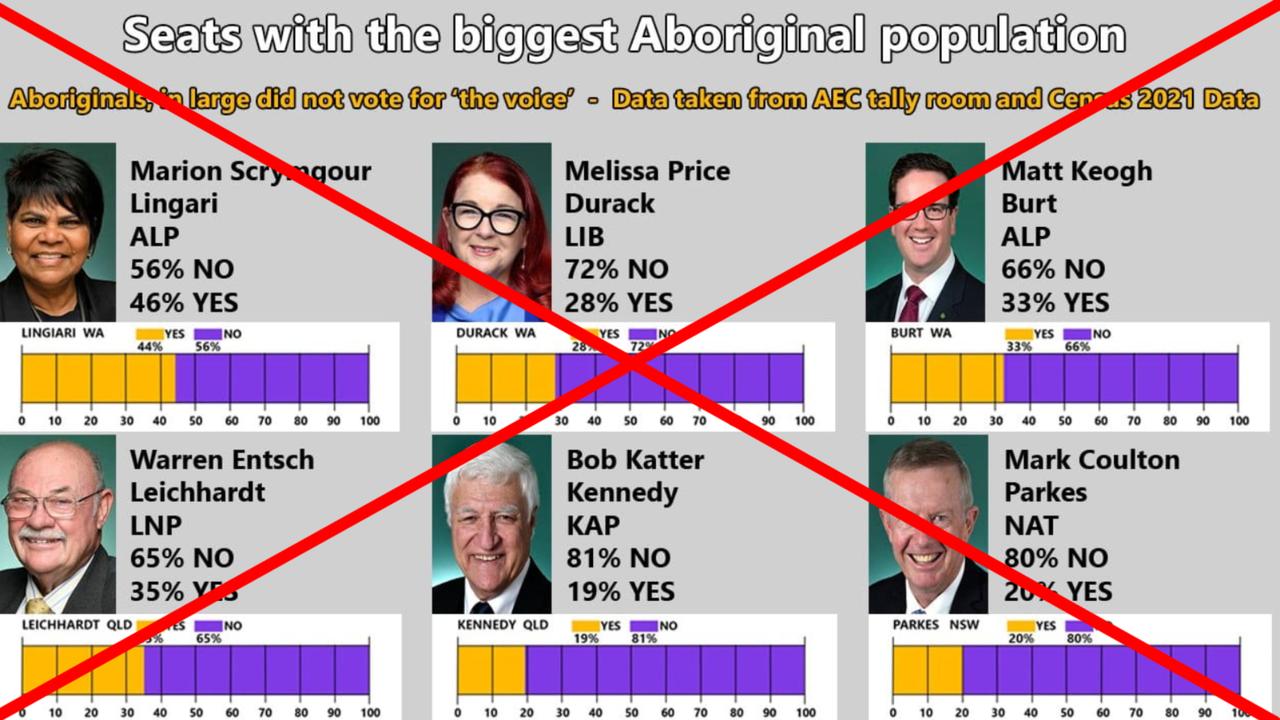
The Facebook posts' graphic shows the results from "Seats with the biggest Aboriginal population" which is described as proof "Aboriginals in large did not vote for 'the voice' in the referendum".
It then lists the total 'yes' and 'no' percentages for each of the electorates.
The six electorates included are Lingiari in the Northern Territory, Durack and Burt in Western Australia, Leichhardt and Kennedy in Queensland, and Parkes in NSW.
The 2021 Census shows most of these electorates have total Indigenous population rates much higher than the national average of 3.8 per cent, which includes those under the age of 18 who cannot vote.
Lingiari has an Indigenous population rate of 40.3 per cent, Durack has 15.2 per cent, Leichhardt is 16.3 per cent, Kennedy is 14.8 per cent, while Parkes has 13.1 per cent.
Oddly, the graphic includes Burt, which has an Indigenous population rate of just 3 per cent, below the national average.
Polling analyst Kevin Bonham described the claim as "completely unsound".
"The graphic is a classic example of what is called the 'ecological fallacy' - trying to measure the way a group of people voted from the overall results in areas with a fairly large number of such people," Dr Bonham told AAP FactCheck.
He noted the inclusion of Burt was inaccurate as it was not in the top six electorates for Indigenous population.
"No Australian division is even 50 per cent Indigenous," Dr Bonham said.
"Divisions with high numbers of Indigenous voters also have high numbers of rural and outback non-Indigenous voters, and these voters tend to vote 'no' very strongly.
"This means that the minority First Nations vote is not enough to drag the 'yes' vote up to 50 per cent."

Antony Green, the ABC's chief election analyst, told AAP FactCheck the proportion of Indigenous voters can't explain the referendum result in a given electorate.
"You can't possibly say a high 'no' vote amongst 120,000 voters can be put down to maybe 15,000 Indigenous voters," he said.
Election analyst Ben Raue agreed.
"Looking at results at the electorate level does not tell you how Aboriginal people vote - just how electorates with relatively large numbers of Aboriginal people vote," he said.
"These seats tend to be rural, and rural voters have tended to vote 'no' in larger numbers."
University of Sydney professor Simon Jackman noted Lingiari still returned a 'yes' vote higher than the national result.
"(Lingari) currently has 44.3% of the vote (for 'yes', at the time of writing), which is way higher than the national figure of 39.3%. So that actually cuts against the argument," Prof Jackman said.
"This analysis would get tossed out even in high school level geography, social studies or statistics."
Experts said results from individual polling booths were a better way to identify how Indigenous people within certain electorates voted.
"Going down to the booth level lets us identify places where the Indigenous population is large - well over 50 per cent in some places - and lets us be more confident that the voting results (show) the votes of Indigenous people," Prof Jackman explained.
Mr Green agreed you could see "patterns" in how Indigenous people voted in areas where there was a high proportion of Indigenous voters.
On Sunday, he posted (below) the results from the remote mobile teams in Lingiari, which suggested Indigenous people in those areas had largely voted for the voice.
Analysis from Prof Jackman shows the Yarrabah, Cherbourg, Palm Island, Remote Mobile Team 3 and 5 polling places - in locations where the population is over 90 per cent Indigenous - had a majority of 'yes' votes.
However, Dr Bonham noted the figures for "remote Indigenous voters should not be treated as necessarily correct for those who are not remote".
Mr Raue agreed that while individual polling booth results could be used to identify trends in remote communities, they can't be used to directly assess how Indigenous people living in cities or metropolitan areas, for example, voted.
The Verdict
The claim that referendum results from electorates with high Indigenous populations show Aboriginal and Torres Strait Islander people voted against the voice is false.
Experts told AAP FactCheck results at the electorate level are not an indication of how Indigenous people voted.
While electorates with large Indigenous populations voted 'no' to the voice, Indigenous voters are still in the minority in these areas.
Individual polling booths in locations with very high Indigenous populations provide better insight, but also can't be used to infer how Indigenous people voted across the nation.
False – The claim is inaccurate.
AAP FactCheck is an accredited member of the International Fact-Checking Network. To keep up with our latest fact checks, follow us on Facebook, Twitter and Instagram.