The Statement
A Facebook post used incorrect figures about death rates as a result of COVID-19 to deny the existence of the pandemic.
The September 25 post by celebrity chef Pete Evans reads: "The truth is that this has never been a pandemic nor has it ever been about protecting people's health. Quite the opposite. This has been about fear, control, $$$ and a new vaccine.
"Can we please move onto the alien invasion now, as the covid boogeyman has well and truly vanished (unless you still trust Polititcians (sic), health 'experts' and the MSM who all rely on this dragging out for as long as possible for their own benefits and agendas)."
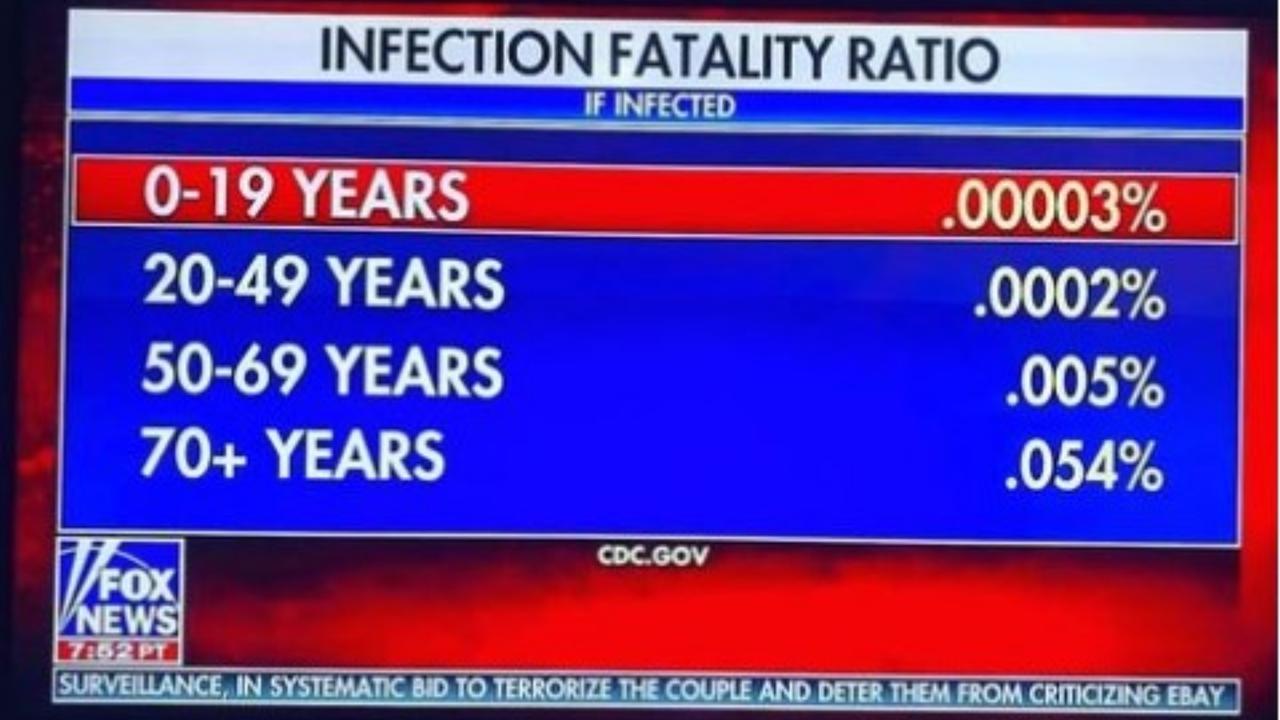
A graphic from Fox News is included in the post showing purported COVID-19 infection fatality rates by a range of ages with the figures attributed to the CDC (US Centers for Disease Control and Prevention).
Under the heading "INFECTION FATALITY RATIO - IF INFECTED", rates are presented as: 0-19 years, .00003%; 20-49 years, .0002%; 50-69 years, .005%; 70+ years, .054%.
At the time of writing, the September 25 post had been viewed more than 47,000 times and shared more than 630 times, attracting more than 2300 reactions and 290 comments.
The Analysis
COVID-19 was declared a pandemic by the World Health Organisation (WHO) on March 11. As of September 29, there have been 33,249,563 confirmed cases of COVID-19, including 1,000,040 deaths, according to the WHO.
However official figures relating to the pandemic have been the subject of numerous false and misleading claims as some question the seriousness of the virus.
In the graphic included in the Facebook post, the COVID-19 infection fatality ratio was presented as: 0-19 years, .00003%; 20-49 years, .0002%; 50-69 years, .005%; 70+ years, .054%.
The figures are an erroneous interpretation of figures presented by CDC. Included in the article COVID19 Pandemic Planning Scenarios, updated on the CDC's website on September 10, there is a table showing the "current best estimate" of infection fatality ratios. These are 0-19 years, 0.00003; 20-49 years, 0.0002; 50-69 years, 0.005; 70+ years, 0.054.
However, the figures are ratios, meaning they have to be multiplied by 100 to get a percentage. Thus the correct percentages of deaths among those infected with COVID-19 in each age cohort, according to the CDC figures, are: 0-19 years, .003%; 20-49 years, .02%; 50-69 years, .5%; 70+ years, 5.4%. These rates are 100 times higher than those included in the post graphic.
The graphic in the post was shown during the Fox News show The Ingraham Angle on September 23 in which host Laura Ingraham discussed the CDC data. A transcript from the show provided to AAP FactCheck by Fox News shows Ms Ingraham citing the survival rate for the 0-19 years age group as 99.997 per cent, and 94 per cent for people age 70 and over.
Fox News confirmed to AAP FactCheck in an email that figures in the graphic were incorrect.
A spokesperson pointed to Ingraham's correct quoting of the data while adding "the percentage symbols in the graphic were shown in error".
Michael Plank, a professor of Applied Mathematics at New Zealand's University of Canterbury and a COVID-19 modeller, also confirmed to AAP FactCheck via email that the figures in the graphic were out by a factor of 100.
Another study, from France, broadly supports the CDC data. It found the overall fatality rate to be 0.5 per cent for those infected with COVID-19. When broken down by age group, the fatality rate ranged from 0.001 per cent in those aged under 20 to 8.3 per cent in the 80-and-over cohort.

The Verdict
The figures shared in the Facebook post about death rates as a result of COVID-19 infections are false. Fox News confirmed to AAP FactCheck the percentage symbols included alongside the figures in the graph were shown in error.
The graphic incorrectly presents CDC estimates of fatality ratios as percentages. The real CDC estimates are 100 times higher than those shown in the image when expressed as percentages.
False - The primary claim within this Facebook post is inaccurate.
* AAP FactCheck is accredited by the Poynter Institute's International Fact-Checking Network, which promotes best practice through a stringent and transparent Code of Principles. https://aap.com.au/